
SaaS Analytics
Real-time analytics and insights platform
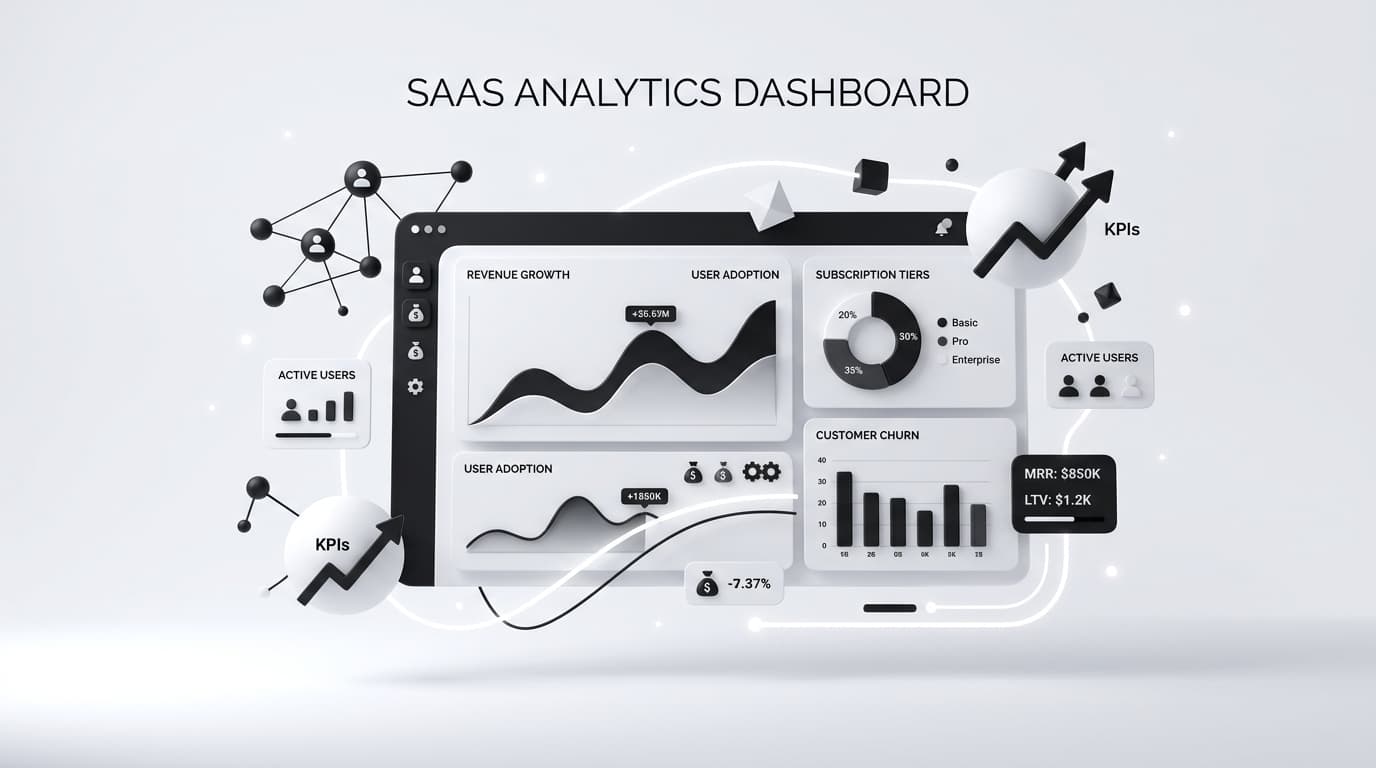
Our SaaS analytics platform helps businesses monitor performance, understand user behavior, and make data-driven decisions. With real-time dashboards and advanced data visualization, you gain complete visibility into your product's growth and performance.
Overview
Our SaaS analytics platform helps businesses monitor performance, understand user behavior, and make data-driven decisions. With real-time dashboards and advanced data visualization, you gain complete visibility into your product's growth and performance.
What You Get
- An event schema designed around your actual product questions
- A tracking plan your engineers can implement consistently
- Live dashboards for the metrics that drive decisions
- Funnel and cohort analysis wired to your activation definition
- Revenue and retention reporting alongside usage
- Documentation so new engineers instrument correctly without us
Execution Methodology
Define the questions before choosing the tools
Most analytics projects fail because nobody agreed what the business needed to know. We start with the decisions, then work out what data those decisions require.
Design the event schema deliberately
Event naming and properties are an interface. Get it wrong and you cannot fix historical data later, so this gets reviewed properly rather than assembled ad hoc during implementation.
Instrument once, consistently
We provide the tracking plan and review the implementation. Instrumentation is where analytics projects quietly break, and it is cheap to prevent.
Connect usage to revenue
Product usage only matters in relation to what customers pay. We connect behaviour to subscription data so the numbers support prioritisation rather than curiosity.
Core Features
Business Impact
Technology Stack Rationale
Event-based tracking
Capturing user actions as discrete events rather than page views is what makes funnels and cohorts possible at all. Page-view analytics cannot answer why users leave a flow.
PostgreSQL
A well-indexed relational store handles behavioural event volumes at a fraction of the cost of a dedicated analytics warehouse, and keeps your data joinable with subscription and billing records.
D3.js and Chart.js
For dashboards that need real interactivity and custom visualisation. Where the requirement is straightforward, a simpler charting approach keeps maintenance lower.
Documented event schema
The single highest-leverage decision in an analytics build. Naming and properties form an interface you cannot retroactively change, so it gets reviewed up front rather than assembled during implementation.
Ideal Profile
- SaaS companies making roadmap decisions without reliable usage data
- Teams whose product analytics are assembled from ad hoc queries
- Businesses that need usage evidence to support a pricing change
- Product-led companies moving from growth experiments to systematic retention work
Frequently Asked Questions
What can we track?
User behaviour, feature adoption, revenue and subscription metrics, funnels, cohorts and retention, plus custom events you define. The schema is built around the questions your team needs answered, which is what keeps it maintainable.
Do we need to replace our current tools?
Not usually. We work with the analytics stack you have and add what is missing. Replacing a working stack mid-cycle costs more than it returns, so we only recommend it when the current tools genuinely cannot answer your questions.
Is this suitable for an early-stage startup?
Yes, though we would start with a tracking plan and a small set of dashboards rather than a full platform. Early stage, the priority is instrumenting correctly once, not building sophisticated reporting.
How do you keep the data trustworthy?
By agreeing definitions up front, reviewing the instrumentation, and writing the metric definitions down so everyone means the same thing by activation, retention or churn. Most disagreements about analytics turn out to be disagreements about definitions.
What kind of data can I track?
You can track user behavior, revenue metrics, product usage, funnels, and custom events in real-time.
Is it suitable for startups?
Yes, our SaaS analytics solutions are scalable and perfect for startups as well as enterprise-level businesses.
Architect a Solution
Engage with our engineering team to outline a robust, scalable architecture tailored to your specific parameters.
Initialize ConsultationParameters
Adjacent Capabilities
Explore integrated solutions across our ecosystem.